| Planetary Boundary | Process/ Mechanism | Inputs | Indicator (with units) | Quantity Now | Quantity at Planetary Boundary | Status | References | Author, Institution | BIRI™ Score |
|---|---|---|---|---|---|---|---|---|---|
| Climate Change | Atmospheric CO₂ concentration — long-lived greenhouse gas forcing | Fossil-fuel combustion, cement production, land-use change | Atmospheric CO₂ concentration (ppm) | 426.89 ppm (May 2025) | 350 ppm | ✖ Beyond Boundary | Trends in Atmospheric Carbon Dioxide – Global Monthly Mean CO₂ | NOAA GML | BIRI 9 |
| Planetary boundaries: Guiding human development on a changing planet | Science (Steffen et al., 2015) | BIRI 8 | |||||||
| Trends in CO₂ – Monthly Average Mauna Loa | NOAA GML | BIRI 9 | |||||||
| Global mean surface temperature anomaly — energy imbalance realized as warming | Radiative forcing from GHGs, aerosols, internal variability, solar/volcanic | GMST anomaly relative to 1850–1900 (°C) | 1.55 °C (2024) | 1.0 W/m² radiative forcing (~350 ppm CO₂) | ✖ Beyond Boundary | WMO confirms 2024 warmest year on record | World Meteorological Organization | BIRI 9 | |
| NASA Confirms 2024 Warmest Year on Record | NASA | BIRI 9 | |||||||
| Planetary boundaries: Guiding human development on a changing planet | Science (Steffen et al., 2015) | BIRI 8 | |||||||
| Biosphere Integrity | Genetic diversity — extinction rate | Habitat conversion, overexploitation, invasive species, pollution, climate change | Extinctions per million species-years (E/MSY) | >100 E/MSY | <10 E/MSY | ✖ Beyond Boundary | Planetary boundaries: Guiding human development on a changing planet | Science (Steffen et al., 2015) | BIRI 8 |
| Accelerated modern human-induced species losses | Science Advances (Ceballos et al., 2015) | BIRI 7 | |||||||
| Earth beyond six of nine planetary boundaries | Science Advances (Richardson et al., 2023) | BIRI 7 | |||||||
| Functional diversity — HANPP | Cropland/pasture expansion, forestry harvest, biomass extraction | Human appropriation of NPP (% of Gt C yr⁻¹) | ≈30% HANPP (16.8 of ~55.9 Gt C yr⁻¹) | 10–20% HANPP | ✖ Beyond Boundary | 2023 Revision of the nine planetary boundaries framework | Government of France (SDES) | BIRI 9 | |
| Earth beyond six of nine planetary boundaries | Science Advances (2023) | BIRI 7 | |||||||
| Stockholm Resilience Centre — Planetary Boundaries | Stockholm Resilience Centre | BIRI 8 | |||||||
| Land-System Change | Forest cover — share of remaining forest | Deforestation for agriculture, logging, fire, infrastructure | Remaining forest area (% of pre-1700 potential) | ≈60% global; Tropical Americas 83.9% | Africa 54.3% | ✖ Beyond Boundary | 2023 Revision of the nine planetary boundaries framework | FAO | BIRI 9 |
| Earth beyond six of nine planetary boundaries | Government of France (SDES) | BIRI 9 | |||||||
| Global Forest Resources | Science Advances (2023) | BIRI 7 | |||||||
| Freshwater Change | Blue water — streamflow deviations | Surface/groundwater withdrawals, dams, transfers | Share of global land with streamflow deviation (%) | 18.2% | 10.2% | ✖ Beyond Boundary | 2023 Revision of the nine planetary boundaries framework | Government of France (SDES) | BIRI 9 |
| Earth beyond six of nine planetary boundaries | Science Advances (2023) | BIRI 7 | |||||||
| Globally widespread violations of environmental flow envelopes | Hydrology and Earth System Sciences | BIRI 7 | |||||||
| Green water — soil moisture deviation | Land-use change, evapotranspiration shifts, irrigation | Land area with root-zone soil-moisture outside Holocene variability (%) | 15.8% | 10% | ✖ Beyond Boundary | A planetary boundary for green water | Nature Reviews Earth & Environment | BIRI 7 | |
| Earth beyond six of nine planetary boundaries | Science Advances (2023) | BIRI 7 | |||||||
| 2023 Revision of the nine planetary boundaries framework | Government of France (SDES) | BIRI 9 | |||||||
| Biogeochemical Flows | Reactive nitrogen creation | Haber–Bosch fixation, crop biological fixation | Anthropogenic reactive N introduced (Tg N/yr) | ≈190 Tg N/yr | 62 Tg N/yr | ✖ Beyond Boundary | Earth beyond six of nine planetary boundaries | Science Advances (2023) | BIRI 7 |
| 2023 Revision of the nine planetary boundaries framework | Government of France (SDES) | BIRI 9 | |||||||
| Planetary boundaries: Guiding human development on a changing planet | Science (Steffen et al., 2015) | BIRI 8 | |||||||
| Phosphorus to oceans/ soils | Fertilizer use, soil erosion/runoff, wastewater | P flow (Tg P/yr) | 22–22.6 Tg P/yr to oceans; 17.5 Tg P/yr to soils | 11 Tg P/yr to oceans; 6.2–11.2 Tg P/yr soils | ✖ Beyond Boundary | Earth beyond six of nine planetary boundaries | Science Advances (2023) | BIRI 8 | |
| 2023 Revision of the nine planetary boundaries framework | Government of France (SDES) | BIRI 9 | |||||||
| Planetary boundaries — Supplement values | Science (Steffen et al., 2015) | BIRI 8 | |||||||
| Ocean Acidification | Carbonate chemistry — Ωarag | Ocean uptake of CO₂ reduces carbonate ions | Aragonite saturation state (unitless) | ≈2.8 (81–84% of pre-industrial) | ≥2.75 | ✖ Beyond Boundary | Earth beyond six of nine planetary boundaries | Science Advances (2023) | BIRI 7 |
| 2023 Revision of the nine planetary boundaries framework | Government of France (SDES) | BIRI 9 | |||||||
| Ocean Acidification — NOAA Education | Science (Steffen et al., 2015) | BIRI 9 | |||||||
| Surface ocean pH decline (carbonate chemistry change) | Anthropogenic CO₂ emissions absorbed by the oceans, dissolving as carbonic acid → shifts carbonate–bicarbonate equilibrium → reduces pH | Mean surface ocean pH (unitless, logarithmic scale) | Pre-industrial average pH ≈ 8.2; present global surface mean ≈ 8.05. Decline of ~0.1 units ≈ ~30% increase in [H⁺]. | Drop of 0.1 units (8.2→8.1) already crossed the PB "zone of uncertainty"; safe operating space defined at ≥ 8.1 | ✖ Beyond Boundary | Ocean Acidification: The Other Carbon Dioxide Problem | Science Advances (2023) | BIRI 9 | |
| Ocean, Cryosphere, and Sea Level Change (pH time series & projections) | Government of France (SDES) | BIRI 10 | |||||||
| Earth beyond six of nine planetary boundaries | Science (Steffen et al., 2015) | BIRI 8 | |||||||
| Stratospheric Ozone | Ozone column | ODS emissions deplete, Montreal Protocol recovery | Total column ozone (Dobson Units, DU) | ≈285 DU | ≥276 DU | ✔ Within Safe Zone | 2023 Revision of the nine planetary boundaries framework | Government of France (SDES) | BIRI 9 |
| Scientific Assessment of Ozone Depletion: 2022 | WMO/UNEP | BIRI 9 | |||||||
| NASA Ozone Watch | NASA | BIRI 9 | |||||||
| Atmospheric Aerosols | Hemispheric asymmetry in AOD | Anthropogenic & natural aerosols, transport | Interhemispheric difference in AOD (unitless) | ≈0.076 | 0.10 | ⚠ Zone of Uncertainty | Earth beyond six of nine planetary boundaries | Science Advances (2023) | BIRI 7 |
| 2023 Revision of the nine planetary boundaries framework | Government of France (SDES) | BIRI 9 | |||||||
| Global Maps: Aerosol Optical Depth (MODIS) | NASA Earth Observatory | BIRI 9 | |||||||
| Regional AOD (South/East Asia) | Regional emissions of SO₂, BC, OC | Regional mean AOD (unitless) | South Asia ~0.30–0.35; East China ~0.40 | ~0.25 (South Asia threshold) | ✖ Beyond Boundary | Planetary boundaries: Guiding human development on a changing planet | Science (Steffen et al., 2015) | BIRI 8 | |
| Earth beyond six of nine planetary boundaries | Science Advances (2023) | BIRI 7 | |||||||
| Global Maps: Aerosol Optical Depth (MODIS) | NASA Earth Observatory | BIRI 9 | |||||||
| Novel Entities | Synthetic chemicals & plastics | Production/release of plastics, PFAS, pesticides, limited assessments | Annual plastic production (Mt/yr) | ≈460 Mt/yr (2019) | No safe quantitative threshold (transgressed) | ✖ Beyond Boundary | Outside the Safe Operating Space of the Planetary Boundary for Novel Entities (Persson et al., 2022) | Environmental Science & Technology | BIRI 7 |
| Global Plastics Outlook (2022) | OECD | BIRI 9 | |||||||
| Global Chemicals Outlook II (2019) | UNEP | BIRI 9 |
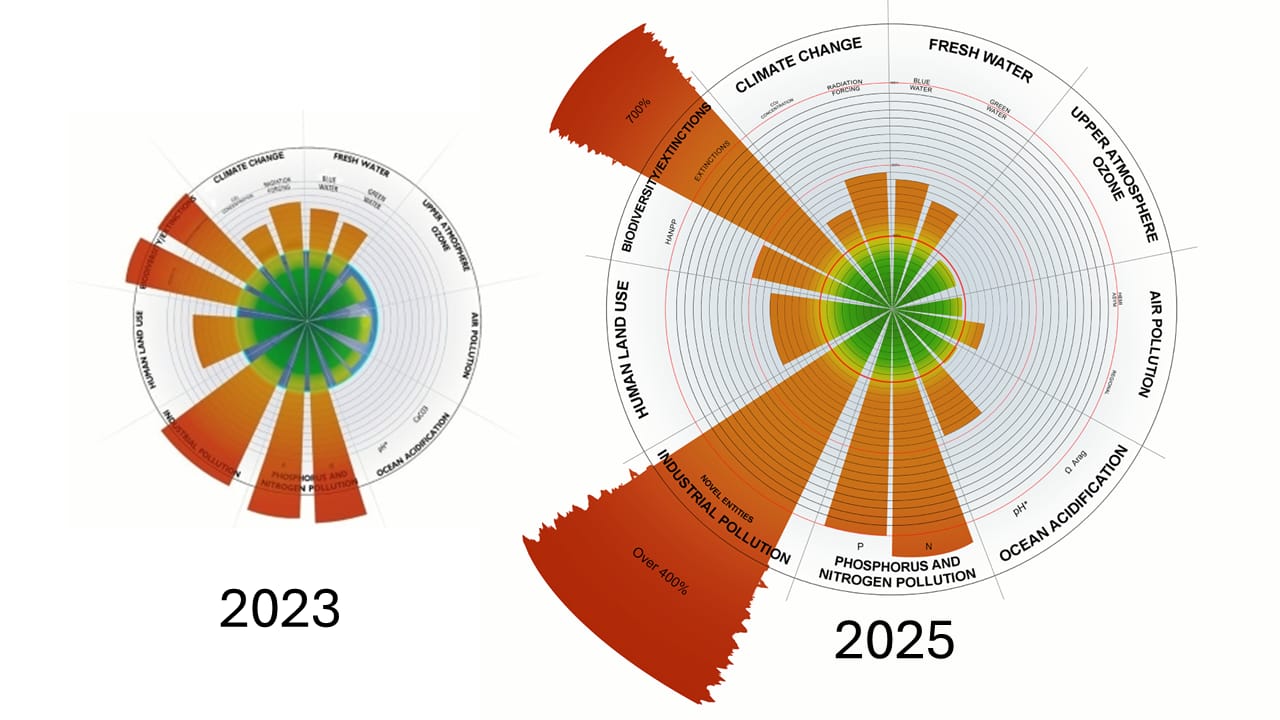
Special mention should be made of ocean acidification which is driven by excess carbon dioxide emissions. The speed at which pH (a measure of acidity) is changing is a major risk. Whilst the absolute measures of measures change, it is the speed at which they change which poses the greatest risk.
The image for 2026 shows the actual scale based on the numbers above.